Rocking Curves#

For each pixel of the detector frames, fit rocking curves as Gaussian peaks.
Signals#
Inputs: Dataset
Outputs: Dataset
Usage#
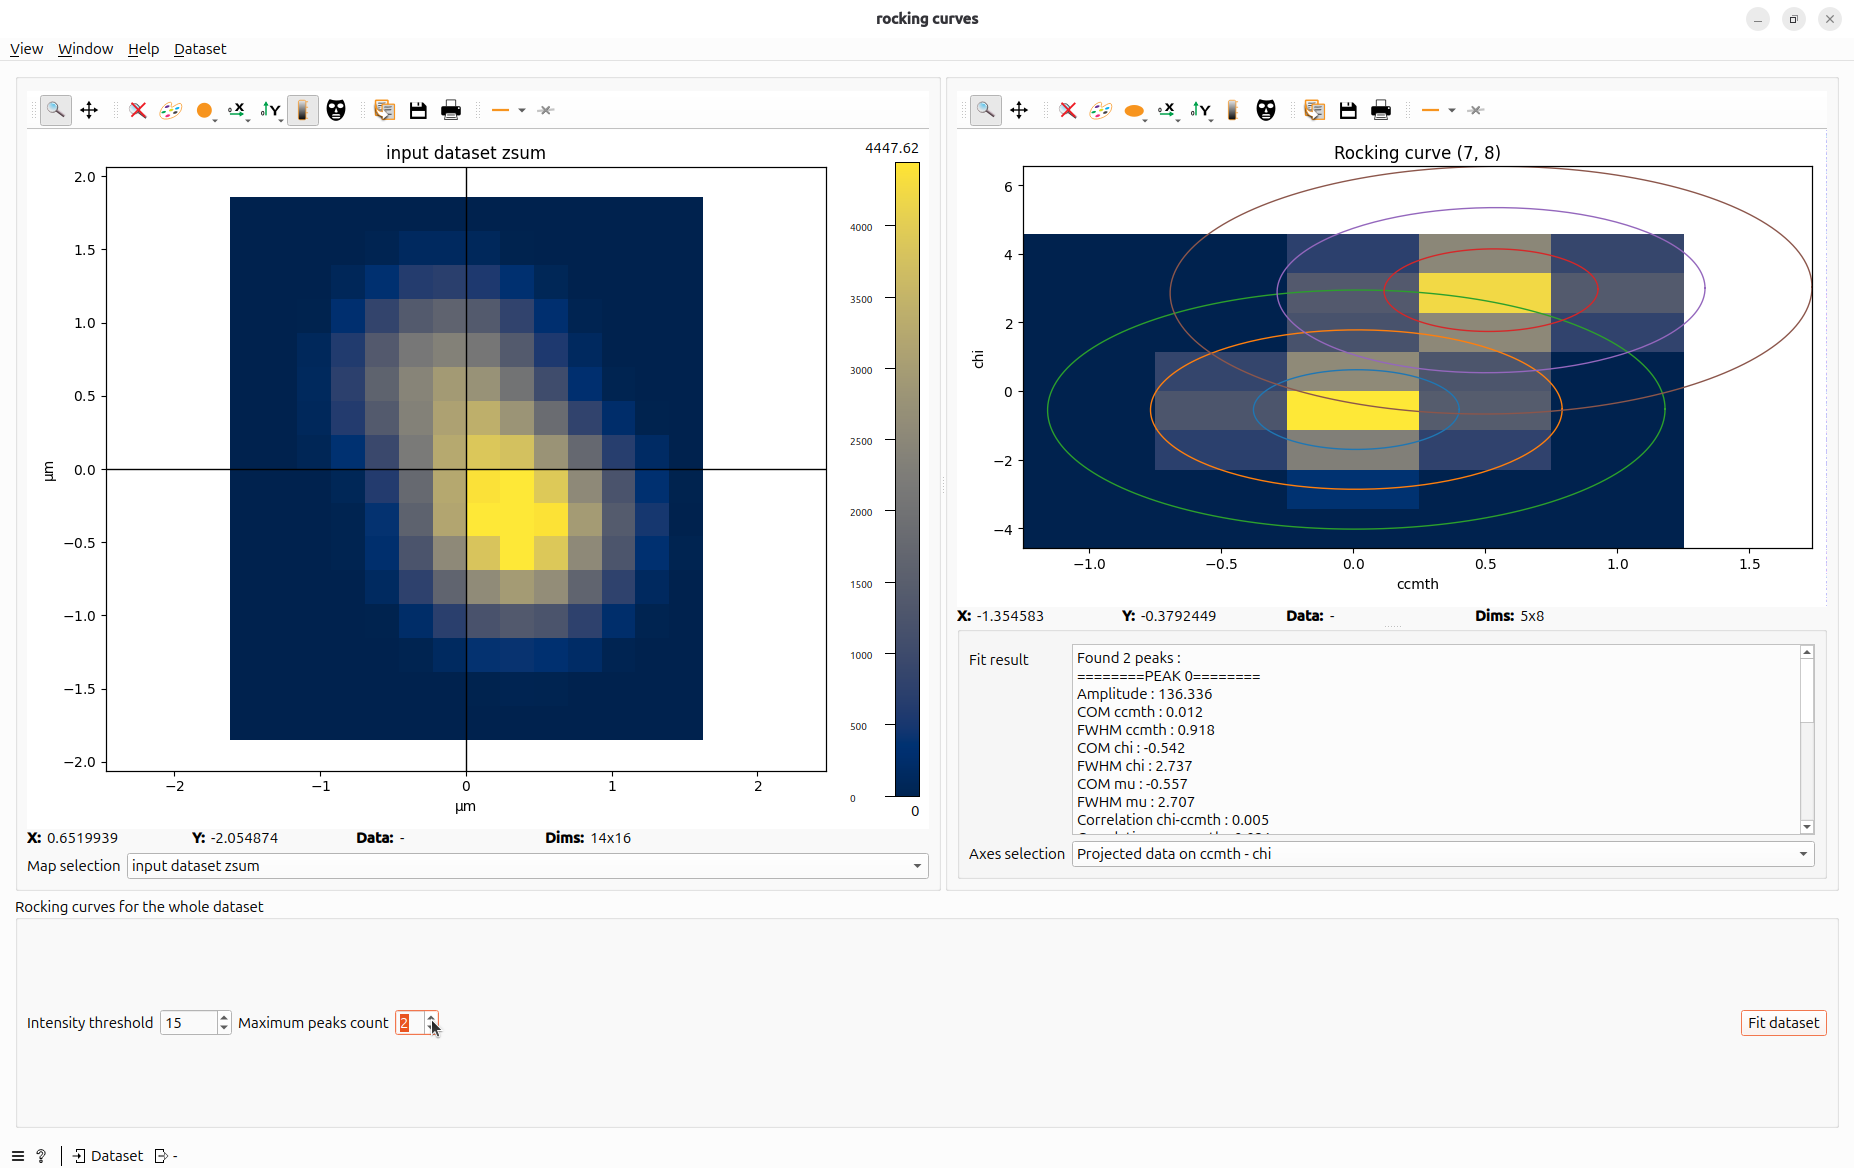
Rocking Curve for one pixel#
Click on any pixel in the left plot to inspect its rocking curve.
You can visualize the data for that pixel in motors space and the proposed fit.
Axes selection allows you to choose a different projection to visualize data.
Rocking Curve for the whole dataset#
Click Fit dataset to fit Rocking Curve for the whole dataset.
Result is shown as maps. You can navigate between maps with map selection combobox.
Data can also be saved as hdf5 with export maps button at the end of the processing.
Hint
In hdf5 file, when multi-peaks are fitted, the first dimension of each map represent the “peak index”. Peaks are sorted from highest amplitude to lowest amplitude.
Common parameters#
Intensity threshold is the bottom threshold to detect a peak. If all data is under this threshold, pixel is skipped.
Maximum Peak Count sets the maximum number of peaks the algorithm can detect for each pixel.