
Grain Plot#
Widget to compute and display grain properties.
Signals#
Inputs: Dataset OR GrainProperties
Outputs: GrainProperties
Details#
This widget can display the following grain maps:
Center of mass (COM): Shows the map of COM for every motor. The center of mass looks at the intensity as a function of a motor position, using the intensity values of the images as a statistical weight
Full width half maximum (FWHM): Same as COM but with the standard deviation
Skewness, Kurtosis: third and fourth-order computed standardized moments
There is also a dedicated tab to the mosaicity for 2D and 3D scans.
Hint
Have a look at the Mosaicity Tab section below for the mosaicity-specific features.
Finally, the last tab is for Kernel Average Misorientation (KAM). See KAM definition by MTEX
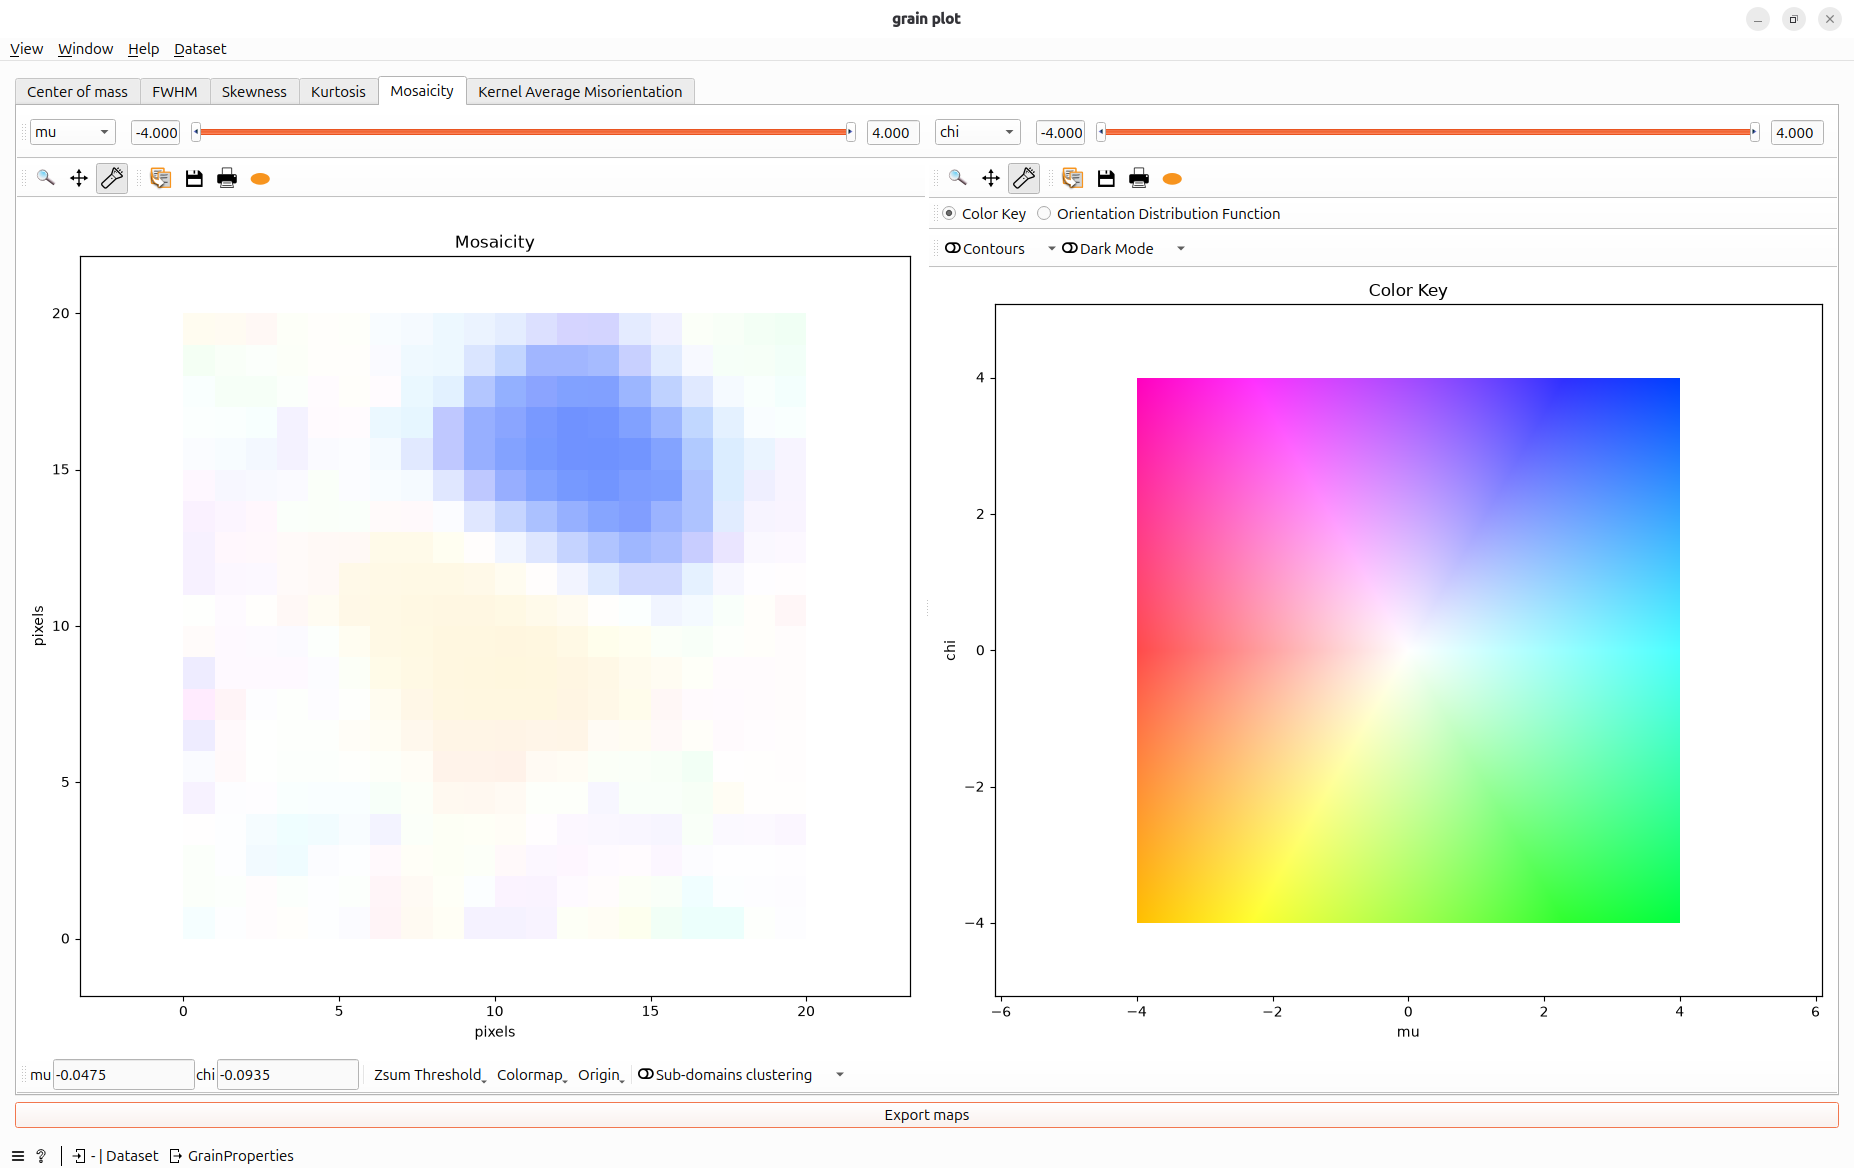
Mosaicity Tab#
The Mosaicity tab is organized around two complementary plots:
On the left, Mosaicity: A 2D view of the center‑of‑mass (CoM)
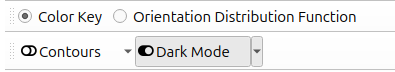
On the right, you can select between Color Key and Orientation Distribution Function.
Color Key is simply the 2D colormap of the mosaicity.
Orientation Distribution Function (ODF) is the result of the following computation for 2 motors \(m_1\) and \(m_2\):
\[\text{ODF}(m_1, m_2) = \sum_{pix_i,pix_j} I(m_1, m_2, pix_i, pix_j)\]where \(I(m_1, m_2, pix_i, pix_j)\) is the pixel \(pix_i, pix_j\) at motor position \([m_1, m_2]\).
Dimension ranges toolbar#

Select two dimensions for the mosaicity and their ranges.
The color key minimal and maximum values in both axes correspond to these ranges.
By reducing the range you will increase the contrast in the mosaicity plot.
Plot toolbar#
Both plots of the mosaicity tab have a plot toolbar.

This toolbar is very common except one special feature named flashlight.
flashlight is a new interactive action that lets the user define a rectangular Region Of Interest (ROI) that follows the mouse cursor.
ROI can be resized by maintaining left button pressed.
ROI center and size is shown below the selection.
The flashlight selection from the right plot illuminates the corresponding range of values in the left plot. The same mapping is done from the left plot to the right plot.
Right plot specific toolbar#
A toolbar to customize the right plot.
Legend
Button |
Action |
|---|---|
Color Key or Orientation Distribution Function |
Switch the right plot between the Color Key and the Orientation Distribution Function. |
Contours |
Toggle Orientation Distribution Function iso-lines contours on the color key. |
Dark Mode |
Highlight orientations present in the mosaicity on the color key. |
Colormap |
Configure the ODF colormap (name, range, normalization…). Applies to both the ODF plot and the contours. |
Common toolbar#
A toolbar with tools that modify both plots.

Legend
Tool |
Action |
|---|---|
Cursor position |
Give the values of the two motors when the mouse cursor is over one plot. |
Zsum threshold |
Discard pixel under a zsum threshold in the mosaicity plot. |
Colormap |
User can select another colormap than the classic HSV for the Color Key. |
Origin |
Move the origin value for the two motors (Keep Motor values / Motors start to zero / Motors values centered) |
Subdomains clustering |
[Experimental] Uses the well-known K-Means clustering algorithm to segment the mosaicity image into several “sub-domains”. |